

This post is part of the Path Series. If you’re new to the series, start with Pension at 55: A Starting Point.


We’re a month into summer, and it’s a natural time for educators to reflect on the past year. The end of a school year carries real weight. As June approaches, the pressure builds, the emotions run high, and getting to the end feels like reaching the top of a mountain. You made it. You also know you’re going to have to climb it again in a few months.
One question that can come up during this time is whether pursuing a career outside of education might be worthwhile. There are plenty of reasons this question might come up from the workload, to the stress, to the low salary. To be clear: I think asking this question and exploring one’s options is fine. I believe folks should make informed decisions and enter (or leave) the profession with eyes wide to the trade-offs. Moreover, I think there are simply too many variables and contextual factors to make general claims about there being a “right” or “best” decision. Life is complicated. Choices are too. I’m not here to shame anyone. Instead, I’m interested in how I can support educators in thinking through a question like: what might be the benefits and drawbacks of taking a particular job?
All of this got me thinking: could I build a tool to help someone think through the financial side of this decision? Not the whole decision, just the big-picture money part. So, that’s what this post is about: showcasing a tool that attempts to roughly compare the financial value of a teaching position against a position outside of education. With the caveat that this is genuinely an apples-to-oranges comparison, this post walks through a sample of what the tool can do by looking at a made-up comparison case.
In every post so far, I’ve been following a teacher I’ve named Pip who lives in Wisconsin and is working toward retirement at 55. As I’ve discussed previously, retirement at 55 is financially achievable, and with modest additional savings through a Roth IRA Pip could retire with close to 100% of their pre-retirement income. But how does this compare to someone who graduated with a teaching degree and chose to work outside of teaching?
This post tries to answer that. I want to introduce a new character, Oliver, and run the two paths side by side. Oliver is Pip’s friend. Same age, same goal (retire at 55), same degree (education), but a different career. He works in the private sector as a corporate trainer, starting at $55,000 a year.
I want to be upfront about what this comparison is and isn’t. It’s not an argument that teaching is better or worse than private sector work. The two paths are genuinely different, and which one looks better depends heavily on assumptions and context that vary by person. What I want to do is show how the tool I built can help with getting a high-level overview of the numbers.
The Starting Point
Pip and Oliver both start working at 23. The assumptions I used are:
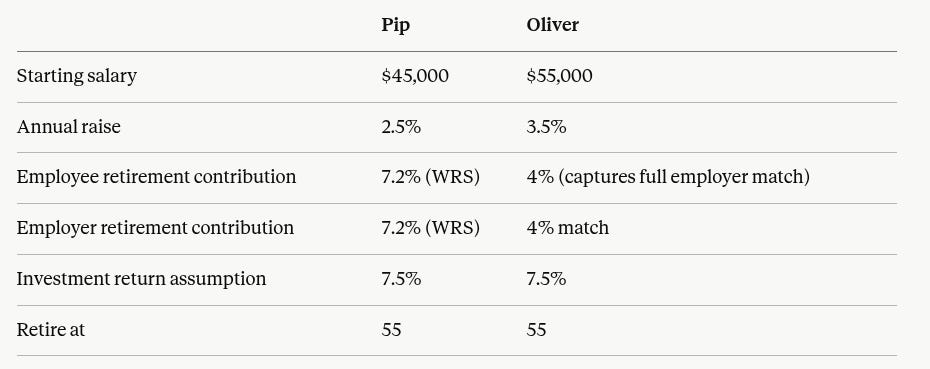
Oliver starts with a 22% salary advantage, a slightly higher raise rate, and more take-home pay. His company offers a 4% match to a 401(k) and he contributes fully to get the match but not any more. This makes his total retirement contribution a smaller percentage of his income. Pip starts lower, contributes more to retirement as a percentage, and works within a defined benefit system rather than a market-dependent one.
One assumption worth naming: both stay on their path for 32 years. That’s realistic for Pip in a way it probably isn’t for Oliver. WRS covers all Wisconsin public school districts, technical colleges, and the UW System, so Pip can move freely across any of those employers without any pension friction. For Oliver, 32 years at a single employer (or even a single 401(k) provider) is an optimistic assumption. Job changes are common in the private sector, and while rollovers preserve the balance, they add friction and decision points that the WRS system eliminates entirely. The comparison is cleanest as stated, but it’s worth keeping that asymmetry in mind.
Thirty-Two Years Later
By the time both reach 55, the salary gap has grown considerably. Oliver’s 3.5% annual raises on a higher starting salary produce a final salary of roughly $159,800. Pip’s final salary is around $96,800. That gap matters, not just for what each person earns during the working years, but for how much retirement income each needs to replace their lifestyle.
On the retirement savings side:
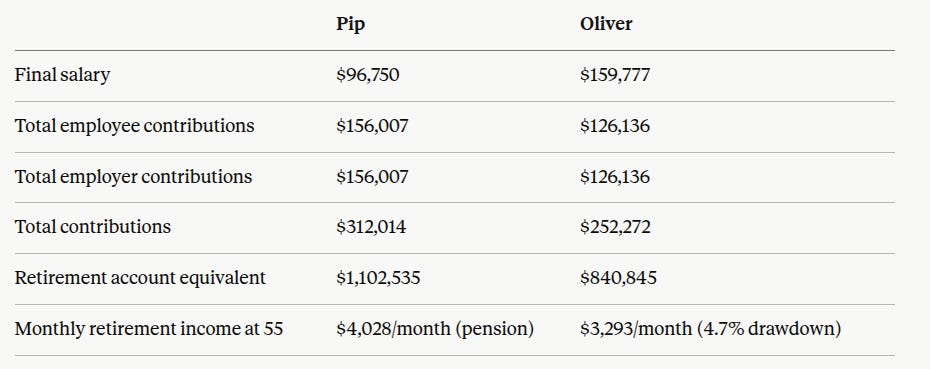
A few things worth noting. Pip contributes more total dollars than Oliver, $312,014 vs. $252,272, despite earning considerably less throughout the career. That’s entirely a function of the WRS contribution rate (14.4% combined) vs. Oliver’s 8%. The higher contribution rate builds savings discipline into the structure of the job rather than leaving it to individual choice.
The raise rate matters more than it might seem. Pip’s 2.5% annual raises compound into a final average salary of $94,410, which drives the WRS pension formula directly. A half-point difference in annual raises produces a meaningfully different pension at the end, which is why the tool lets you adjust this assumption.
Oliver’s monthly figure assumes he draws down his balance at 4.7% annually, the same rate used elsewhere in this series. His balance at 55 also requires a 72(t) SEPP distribution to access penalty-free before age 59½, a workable but inflexible arrangement worth understanding before relying on it.
Neither Pip nor Oliver can access Social Security until 62 at the earliest. Oliver’s benefit will be higher, reflecting his higher lifetime earnings, but that advantage doesn’t arrive until at least seven years into retirement for both.
Where Pip Has the Advantage (in this scenario)
The income is guaranteed. Pip’s $4,028/month arrives regardless of what markets do in the years immediately following retirement. Unlike Oliver’s drawdown, it isn’t subject to sequence of returns risk — a bad decade at the start of retirement can permanently impair a drawdown portfolio in ways a pension is immune to. The WRS also periodically adjusts benefits based on investment performance. These adjustments can go up or down, but the base benefit is protected.
Accelerated payments. The WRS system gives Pip the option to take accelerated payments from 55 to 62, which add projected Social Security amount onto the monthly pension during that window. When Pip becomes eligible for Social Security at 62, the pension adjusts back down. It is not strictly more money, but it provides a different kind of income flexibility in the early retirement years.
No early access friction. The WRS pension starts at 55 cleanly by design. Oliver needs a 72(t) SEPP arrangement to access his 401(k) before 59½.
Survivor benefits. Pip can elect a survivor benefit option that continues payments to a spouse for their lifetime, at the cost of a reduced monthly amount. Oliver’s 401(k) balance is inheritable, but the mechanics are different.
WRS portability is broad. WRS covers all Wisconsin public school districts, technical colleges, and the UW System. Pip can move freely across any of those employers without any pension friction. This is a larger system than most people realize.
There is space to pause without significant penalty. If Pip takes a 3 to 5 year break mid-career (e.g., for family, health, or other reasons) and returns to teaching before 55, the pension penalty is smaller than the raw service year difference suggests. The WRS formula depends on both years of service and final average salary. A teacher who teaches 27 years but finishes at 55, after a break, still earns a pension based on their age-55 salary. The break costs service years but doesn’t reset the salary clock. A mid-career pause costs less in Pip’s system than in most.
Where Oliver Has the Advantage (in this scenario)
Higher salary during the working years. Oliver earns roughly $63,000 more per year by the end of his career. That’s a significant difference across three decades, and it means Oliver has more runway to save beyond the employer match if he chooses to.
The balance is inheritable. Oliver’s 401(k) passes to heirs. Pip’s pension may provide survivor benefits for a spouse but generally does not pass to children or other heirs. Oliver will need careful tax planning if he wants to pass that balance on without a significant tax burden.
Career flexibility beyond Wisconsin. Oliver can change industries, move states, or shift employers without any system-level friction. His contributions follow him anywhere.
Upside is uncapped. The 7.5% return assumption is conservative. Oliver can choose more aggressive portfolio allocations, which could meaningfully increase his balance and monthly income at retirement. Pip's pension is fixed by formula regardless of how well WRS investments perform. That said, Oliver's freedom to adjust allocations also comes with the risk of poor choices and the constraints imposed by his 401(k) custodian.
Higher Social Security eventually. Oliver’s higher lifetime earnings produce a larger Social Security benefit. That advantage arrives at 62 at the earliest, seven years into retirement for both.
The Apples-to-Oranges Problem
The reason this comparison resists a clean conclusion is that the two instruments are fundamentally different.
Pip’s pension is an annuity, a guaranteed monthly income stream for life, backed by the State of Wisconsin, and more protected against market conditions and longevity risk. All the money contributed by Pip and employers over the years is gone at 55. It cannot be cashed it out. Oliver’s 401(k) is a balance, a sum of money that needs to be managed, protected from sequence risk, drawn down carefully, and potentially outlasted.
An annuity and a balance are not the same thing, and converting one to the other for comparison purposes requires assumptions that can swing the result significantly. The $4,028 vs. $3,293 monthly figures are a reasonable starting point, but they rest on a specific return assumption, a specific withdrawal rate, and a specific career length. Change any of those and the comparison shifts.
What the numbers do show clearly: Pip reaches 55 with a higher monthly income than Oliver despite earning substantially less, and does so with guaranteed rather than projected income. Oliver reaches 55 with a much higher salary, more flexibility, and a balance he controls, but faces more complexity in actually executing a retirement at 55.
Neither outcome is obviously better. They reflect different tradeoffs that different people will weigh differently.
The Tool
The assumptions above are a starting point, not the answer. A teacher with a higher starting salary, a private sector worker with a more generous match, or someone expecting to work 28 years instead of 32 will see a different picture. The tool lets you adjust the variables and see how the comparison shifts.
Give it a try and let me know what you think.
~Josh
If you enjoyed this post, please share it with a friend! As always, I’m a mathematics educator, not a financial advisor. This post is for educational purposes only. If you have questions or topic ideas, reach out at personalfinanceforeducators@gmail.com.